

0 Comentarios
Deja un comentario
Por Francisco R. Villatoro, publicado el 8 marzo, 2013
Categoría(s):
⇦ Dibujo20130307 gustatory neurons in sensilla on the honeybee mourthparts
Categoría(s):
⇦ Dibujo20130307 gustatory neurons in sensilla on the honeybee mourthparts
Repito el comentario aquí, por si el autor del blog puede ayudarme a resolver la duda. Los potenciales de acción superpuestos a la izquierda que identifican a cada neurona del registro continuo (son los trazos de la derecha), tienen una escala en voltaje que no se corresponde con el trazo continuo. No tengo acceso al trabajo original y por tanto desconozco si hay algún dato que me pierdo, bien en el pie de figura original o bien en el texto del artículo. Pero así tal cual aparece aquí, hay un error de escalas en el voltaje… que para ser la revista science ya les vale.
salud y gracias
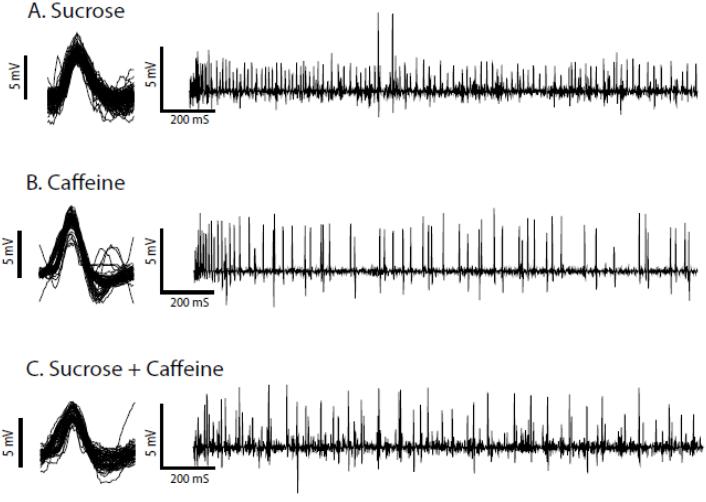
Xotk, la figura aparece en la información suplementaria del artículo (de acceso gratuito). El pie de figura es el siguiente: «Fig. S3. Gustatory neurons in sensilla on the honeybee’s mouthparts can detect caffeine in sucrose solution. A tip recording was made from the honeybee’s galeal sensilla as reported in Wright et al. (2010) (27). Recordings were made for 2 s; traces are representations from the same sensillum. (A) The response to 0.3M; (B) the response to 0.01 M caffeine; (C) the response to a mixture of 0.3M sucrose and 0.01M caffeine.»
El artículo de Wright et al. (2010) (acceso gratuito) también presenta los mismos ejes (Fig. 1).
Dentro del artículo se menciona la figura S3 en este párrafo: «Caffeine is bitter tasting to mammals and is both toxic (24) and repellent to honeybees at high concentrations (25, 26). If bees can detect caffeine, they might learn to avoid flowers offering nectar containing it (27). We found that honeybees were deterred from drinking sucrose solutions containing caffeine at concentrations greater than 1 mM (Fig. 4); they also have neurons that detect caffeine in sensilla on their mouthparts (fig. S3). However, nectar concentrations did not exceed 0.3 mM (0.058 mg/ml), even though levels of caffeine in vegetative and seed tissues of Coffea have been reported to be as great as 24 mg/ml (28). This implies that pollinators drive selection toward concentrations of caffeine that are not repellent but still pharmacologically active.»
Hola Francis, gracias por las notas originales del texto y el texto claro. Pero la cuestión de escalas no aparece en los pies de figura,se explica que se muestran los dos segundos y pero no si la señal aislada (la que está a la izquierda del registro continuo, se extrae de la primera, por tanto la duda/error sigue). He leído los métodos, y claramente para registrar utilizan tanto patch clamp como voltage clamp. En el caso que se muestra debe ser un clásico de current clampo pues el valor de escala está en mV. NO se aclara ni en método ni en la figura ese error. Desde mi punto de vista esto es poco importante si fueran un poco honestos y declarasen que hay error de escala. Lo cual no pone en dudas los resultados.
salud y gracias por las notas y textos que me han permitido entender mejor el trabajo.