

Por Francisco R. Villatoro, publicado el 21 mayo, 2013
Categoría(s):
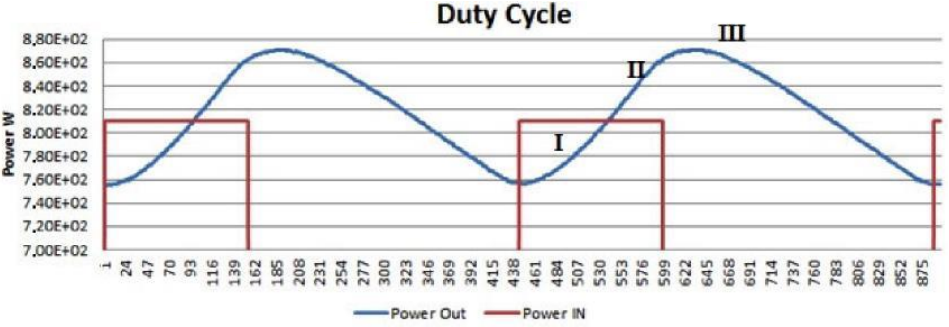
⇦ Dibujo20130520 Chart showing emitted power -blue- and consumed power -red- vs time for the ECat HT2
Categoría(s):
⇦ Dibujo20130520 Chart showing emitted power -blue- and consumed power -red- vs time for the ECat HT2